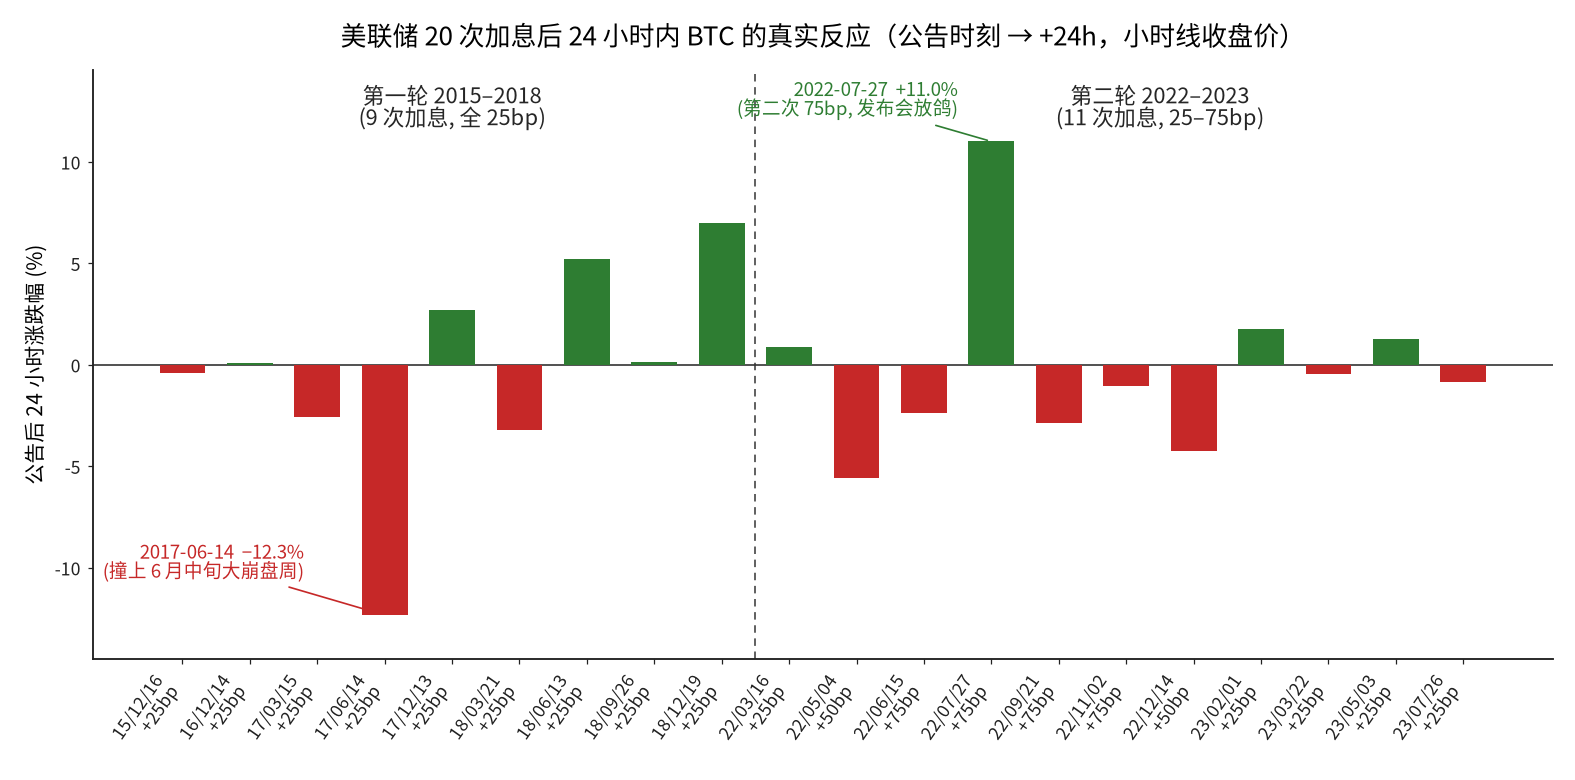
Conclusion first: the hike itself does not decide the direction of crypto prices. Across 20 hikes, BTC’s average 24-hour move is just −0.3%, with a 45% vs 55% rise/fall split — statistically a coin flip. What actually moves the market is the wording on the future path that Powell delivers at the press conference half an hour after the decision — there was one case of a second consecutive 75bp hike that coincided with a broad 10%+ rally, precisely because the press conference came out dovish.
The Fed meets again today (September 16). The market is fiercely split on whether it will hike 25 basis points, and prediction markets briefly pushed the hike probability to 83%. At every such juncture, social media starts circulating confident claims like “the Fed is hiking, crypto is going to crash” or “once the hike lands, it’s sell the rumor, buy the news.”
These claims share one problem: nobody has actually run the numbers. Crypto trades 24/7, FOMC decisions drop at 2:00 AM Beijing time, and much of the online “soared/crashed after the hike” narrative is really quoting calendar-day changes — folding in the volatility from the half day before the announcement.
So I simply went back and computed all 20 Fed hikes of the crypto era (2015 to present), one by one: anchoring at the announcement moment (2:00 PM ET on Wednesday) as t=0, using hourly closes, precisely out to +24 hours. Coverage spans six major coins: BTC, ETH, XRP, LTC, ZEC, and DOGE.
Methodology: Why “Announcement Moment → +24h” Is the Right Window
Most online articles use “the change on hike day” — if the hike is on a Wednesday, they compare Wednesday’s UTC close to Tuesday’s. But the FOMC decision is published at 2:00 PM ET on Wednesday, so that convention lumps in all the volatility from early Wednesday through the afternoon (pre-announcement) — a stretch when the market is trading expectations, not facts.
The standard event-study approach anchors at the announcement moment. That’s what I did: p0 is the price at the announcement moment (the close of the hourly candle at the announcement hour), p24 is the price 24 hours later, and the return = p24/p0 − 1.
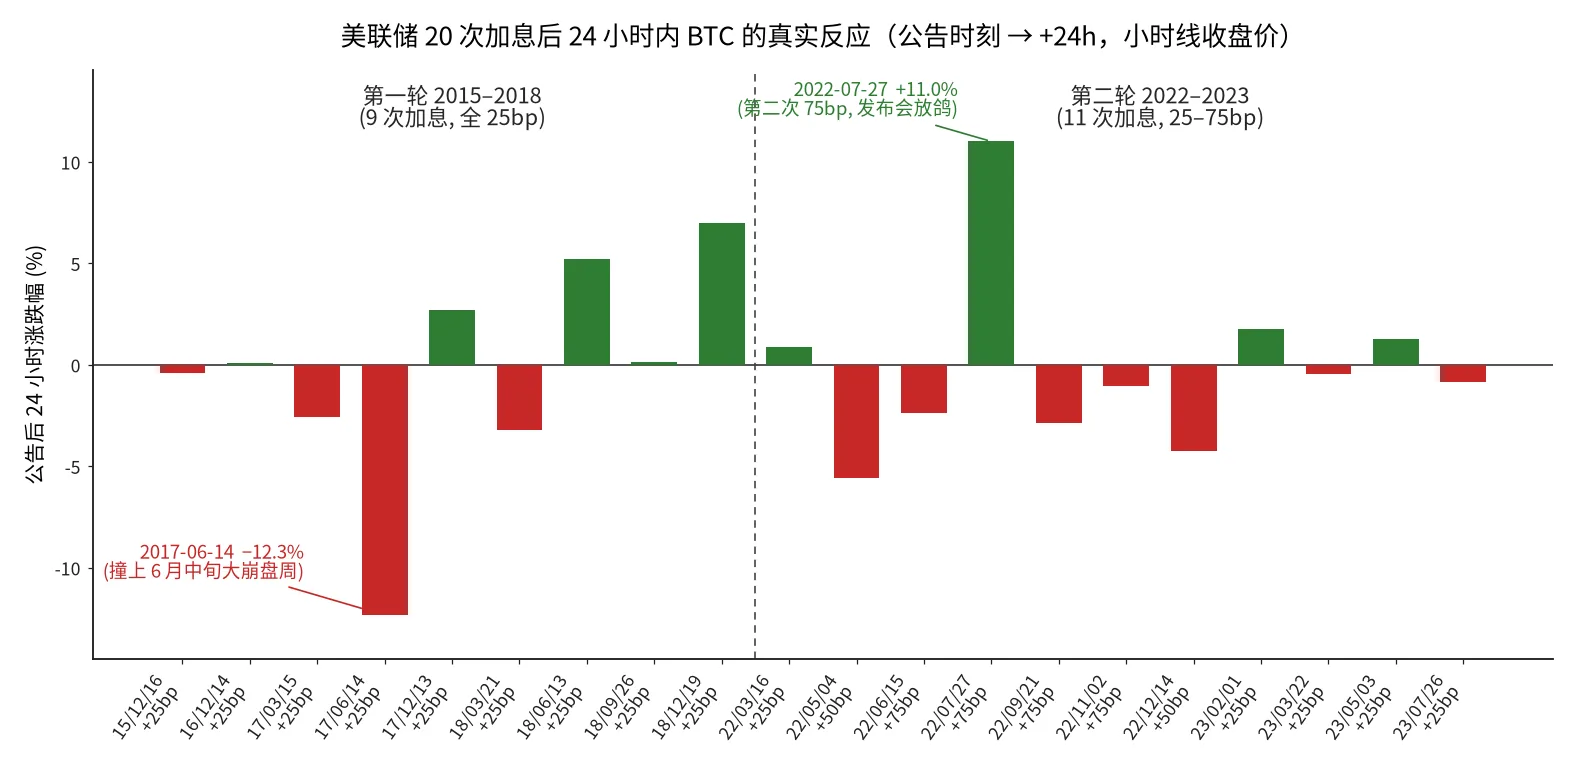
The chart above shows all 20 BTC results. Red and green alternate almost symmetrically — that’s what “no directional pattern” looks like, visually.
Full Data: 20 Hikes × 6 Coins
| Date | Size | BTC | ETH | XRP | LTC | ZEC | DOGE |
|---|---|---|---|---|---|---|---|
| 2015-12-16 | 25bp | −0.4% | *−5.1%† | −0.9% | +3.7% | not yet launched | +3.3% |
| 2016-12-14 | 25bp | +0.1% | −5.3% | −1.5% | +1.3% | −10.2% | +0.1% |
| 2017-03-15 | 25bp | −2.6% | +19.8% | −0.6% | +7.6% | +6.8% | +2.5% |
| 2017-06-14 | 25bp | −12.3% | −15.9% | −12.4% | −4.5% | −17.1% | −13.1% |
| 2017-12-13 | 25bp | +2.7% | −1.2% | +85.4% | −12.9% | +22.2% | −3.0% |
| 2018-03-21 | 25bp | −3.2% | −4.7% | −3.3% | −3.8% | −4.3% | not yet launched |
| 2018-06-13 | 25bp | +5.2% | +9.2% | +7.2% | +8.9% | +7.9% | not yet launched |
| 2018-09-26 | 25bp | +0.1% | −0.3% | +0.6% | +7.8% | +3.3% | +1.5% |
| 2018-12-19 | 25bp | +7.0% | +8.8% | +0.7% | +6.7% | +8.9% | −3.1% |
| 2022-03-16 | 25bp | +0.9% | +3.8% | +2.7% | +2.7% | +4.8% | +2.3% |
| 2022-05-04 | 50bp | −5.6% | −3.8% | −3.0% | −5.1% | −2.4% | −2.0% |
| 2022-06-15 | 75bp | −2.4% | −5.5% | −0.8% | −0.9% | −7.4% | −1.3% |
| 2022-07-27 | 75bp | +11.0% | +16.6% | +10.2% | +16.9% | +10.4% | +11.0% |
| 2022-09-21 | 75bp | −2.9% | −6.2% | +6.4% | −4.2% | −4.4% | −2.0% |
| 2022-11-02 | 75bp | −1.0% | −1.2% | −0.3% | +2.6% | −0.4% | −1.5% |
| 2022-12-14 | 50bp | −4.2% | −4.3% | −2.4% | −4.9% | −0.8% | −5.0% |
| 2023-02-01 | 25bp | +1.8% | +3.6% | +1.4% | +1.8% | +1.7% | +0.9% |
| 2023-03-22 | 25bp | −0.4% | +1.7% | +0.6% | +13.0% | +4.5% | +1.7% |
| 2023-05-03 | 25bp | +1.2% | −0.7% | +0.4% | +1.1% | −0.8% | +0.3% |
| 2023-07-26 | 25bp | −0.8% | −0.6% | +0.2% | +0.9% | −1.1% | −1.5% |
†ETH on 2015-12-16: the hourly-candle method yields +16.9%, but a check of the tick-by-tick trades shows a string of low-liquidity cascading sell orders in the 44 minutes before the announcement that distorted the “announcement-moment price” (0.94 down to 0.80; it recovered to 0.97 within an hour after the announcement). Cross-checking with CoinMarketCap daily snapshots, ETH actually moved about −5% that time. The table reflects the corrected figure, and this artifact is excluded from the statistics below.
Notes on data sources: all figures come from exchanges’ public hourly candles (Binance, Bitstamp, Poloniex, and Coinbase, used per data availability in each period; USDT-quoted vs USD deviation <0.1%). Where a coin did not exist yet, it is marked “not yet launched.” For the 6 BTC events with the largest moves, I additionally cross-verified against independent news records and a second exchange’s candles — all checked out.
Statistical Pattern: In One Sentence, There Is No Pattern
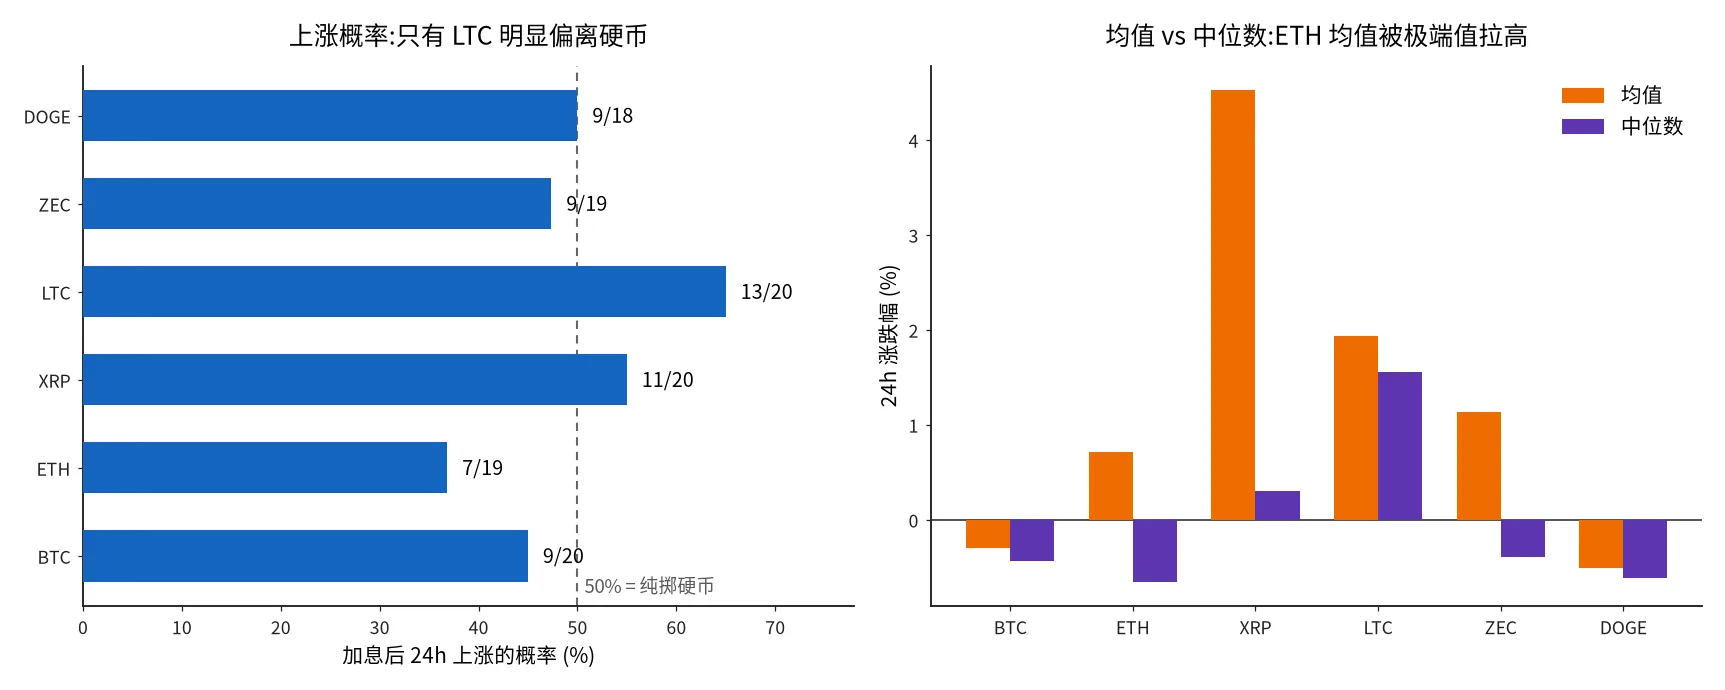
Aggregating all 20 events:
- BTC: up 9 times, down 11 times (45% rise probability), mean −0.30%, median −0.43%. Broken out by cycle, it barely changes: the 2015–2018 cycle averages −0.39%; the 2022–2023 cycle averages −0.22% with a median of −0.83%. Two cycles, two macro environments, same conclusion — a coin flip.
- ETH: after excluding the 2015 artifact, up 7 times, down 12 times, median −0.65% — slightly weaker than BTC. The +0.7% mean looks positive, but that’s an artifact of two ±16–20% swings on a tiny-cap market in 2017 — ETH had been listed for only two years back then, and ±20% days were routine. It had nothing to do with the Fed.
- XRP: median +0.3%; the +4.5% mean is likewise contaminated by one extreme value — the +85.4% on 2017-12-13, which simply coincided with XRP’s own epic run (December 2017 was XRP’s berserk month). Unrelated to the hike.
- LTC: the only coin that clearly deviates from a coin flip — up 13 of 20 times (65%), median +1.56%. With only 20 samples, I won’t claim “buy LTC on hikes” is a strategy, but the deviation is worth keeping on file and tracking after the next hike.
- ZEC / DOGE: medians both in the −0.5% to −0.6% range. Coin flips.
The Real Pattern Hides in the Press Conference
Looking back, almost every single event’s direction has an explanation unrelated to the “hike.” The three most extreme examples:
2017-06-14, BTC −12.3% — the hike didn’t cause the sell-off. That day coincided with the mid-2017 crash week (BTC fell from around $2,600); the Fed was just background noise. Attributing that drawdown to “the hike” is textbook correlation-as-causation.
2022-07-27, all coins +10% to +17% — a second consecutive 75bp hike, and a big rally. This is the most instructive case: 75bp was the largest hike in history at that point, so if “hikes are bearish” meant anything, it should have shown up here. Instead the market rallied across the board (LTC +16.9%, ETH +16.6%, BTC +11.0%). The reason is simple: Powell explicitly said at the press conference that “at some point it will become appropriate to slow the pace of increases” — the market is buying the future, not the size of this hike.
2022-05-04 and 2022-12-14, down 4% to 6% each — the declines weren’t caused by “50bp” either. What both events had in common was a hawkish press conference: in May, Powell flatly rejected hopes of a less aggressive path; in December, the dot plot implied a higher terminal rate for 2023. What sold off was “future tightening,” not “this hike.”
So for the question “Fed hikes → do crypto prices go up or down,” the honest answer from 20 samples is:
- The decision itself (25 vs 50 vs 75bp) carries almost no pricing information — the market has fully priced it in before the announcement, which is also why the announcement moment is often not the moment of maximum volatility.
- The incremental information is in the press conference: hawkish or dovish wording on the future path is the real source of ±5%-scale moves.
What This Means for Today (September 2026)
The decision lands at 2:00 PM ET tonight (2:00 AM Beijing time, September 17), with the press conference half an hour later. Based on the 20 historical samples, my playbook:
- Don’t bet on the decision’s direction. Historically, BTC’s average 24h reaction to a hike landing is −0.3% with a 45% win rate — no tradable edge whatsoever.
- Both historically anchored scenarios live in the press conference:
- Hike + dovish press conference (hinting this is the last of the cycle) → analogous to 2022-07-27, when a broad +10%-scale rally actually happened;
- Hike + hawkish (dot plot moves higher) → analogous to May/December 2022, a broad −4% to −6% sell-off.
- If you’re going to act, wait for the press conference to set the tone, instead of betting on the 2:00 PM print.
- A note for options sellers: coin-flip pricing means the two hours spanning decision + press conference will most likely see elevated volatility, so selling volatility is riskier than usual.
Finally, the usual caveats: only 20 samples, limited statistical power; LTC’s 65% rise probability could be small-sample noise; early data for a few small coins in 2015–2016 comes from hourly candles on very thin exchanges — cross-verified, but still less precise than post-2018 data. This is data analysis, not investment advice — but at least the next time someone declares with total confidence that “crypto crashes whenever the Fed hikes,” you can throw this table at them.
(Notes on data and computation: the t0/t24 prices for the 20 events come from the public hourly-candle APIs of the exchange with the best data availability in each period; the announcement moment is uniformly 2:00 PM ET on Wednesday. Extreme events were double cross-verified against a second exchange’s candles and news records.)